Take your decisions beyond
slides and spreadsheets
Visualize and connect your data in one interactive view.
See how every portfolio, project, and initiative aligns with your strategic goals for smarter, faster decisions.
Software trusted by global organizations, including Siemens, Rolls-Royce, and Volvo Group.









The only platform to unify, visualize, and explore both qualitative and quantitative data across silos
Roadmapping
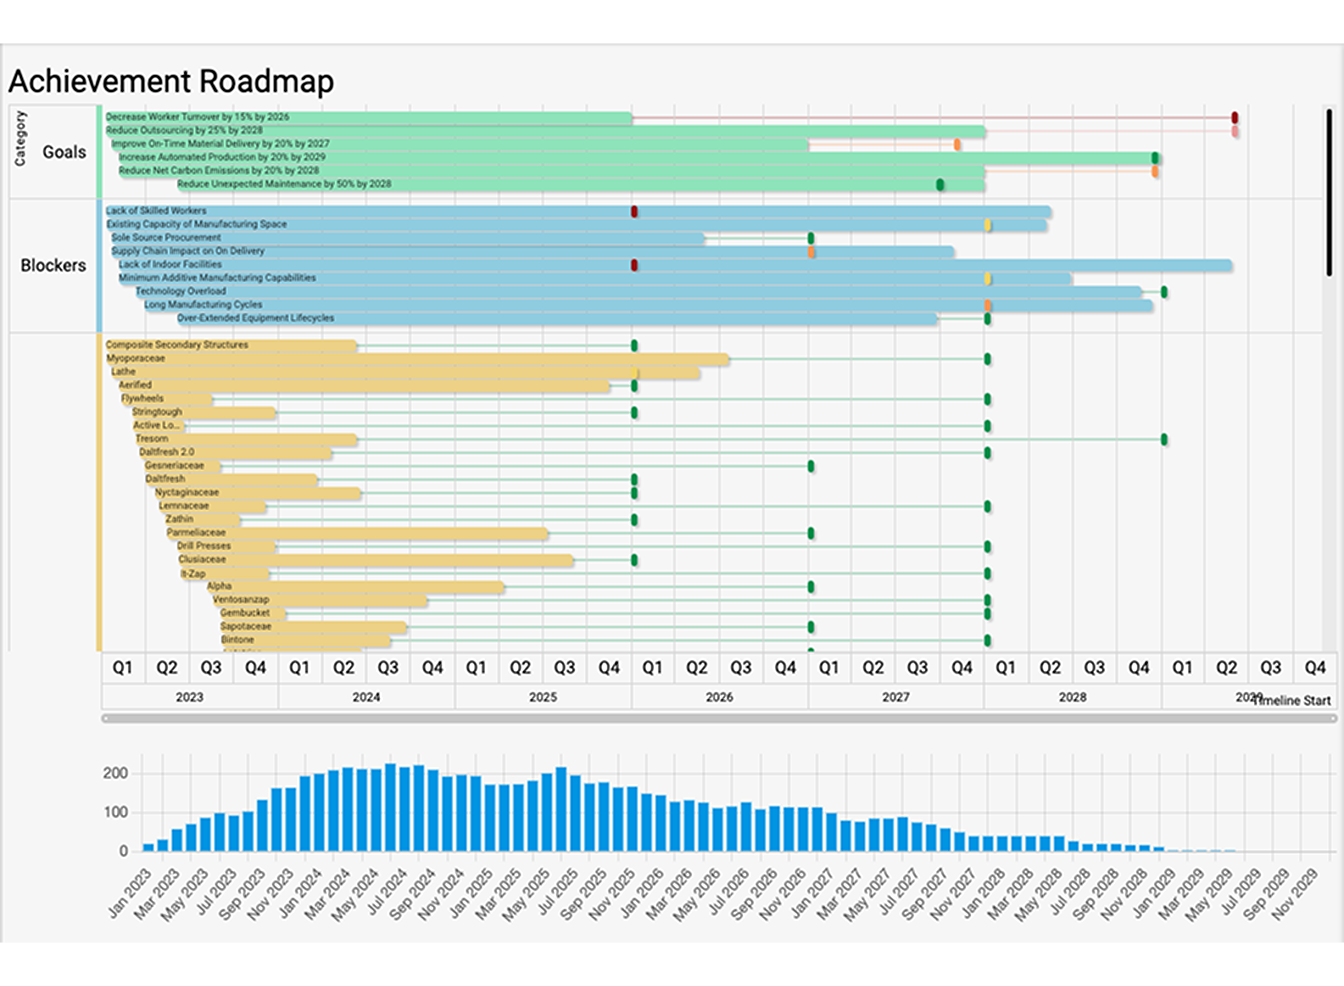
Roadmapping is more than just a timeline. We support the entire process in order for you to create a clear, connected, and concise plan that can be effectively communicated and interacted with.
Portfolio Management
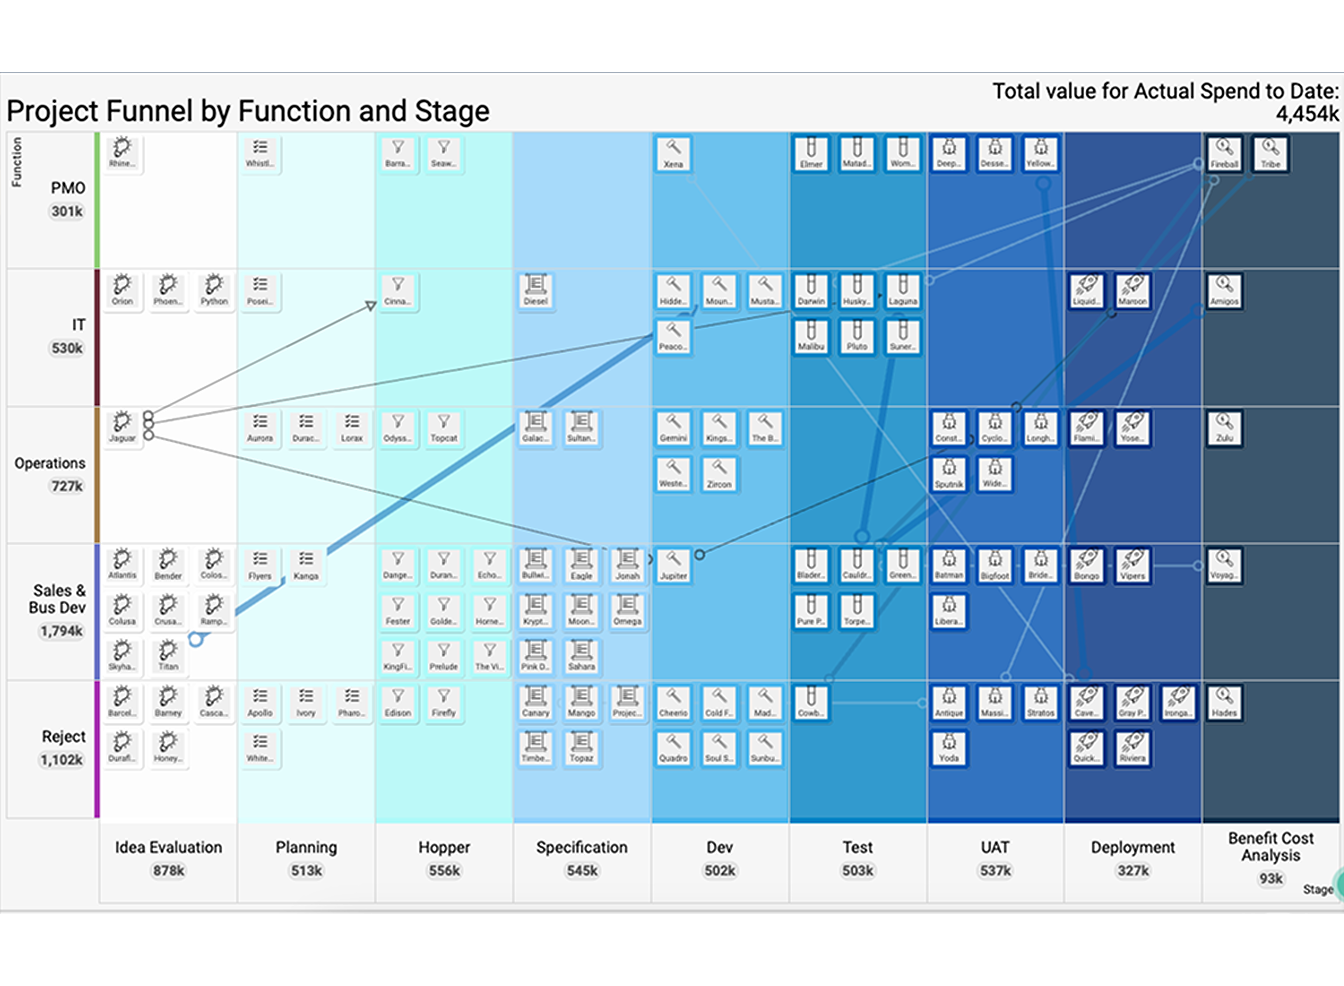
Understanding your portfolio is easier when you can see the bigger picture. Whether you're prioritizing, planning, or conducting health checks, we support you at every stage. Engage interactively with your portfolio and visualize the impact of your decisions in real time - right within the conversation.
Risk Management
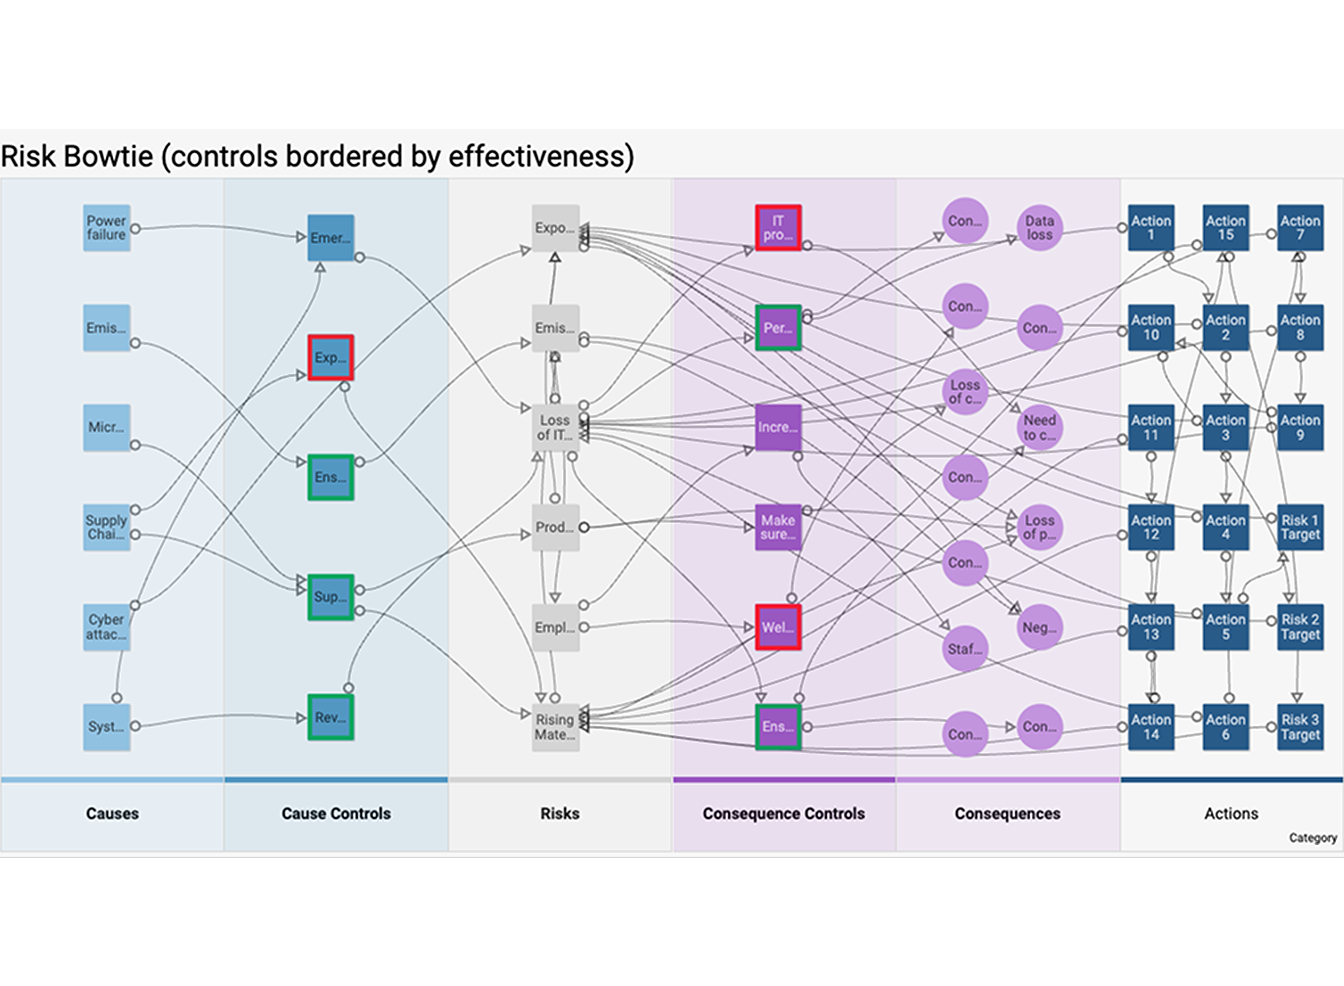
Risks can be managed in many ways, but spreadsheets have their limits. Go beyond rows and columns - visually explore and interact with the relationships between risks, controls, consequences and more. Create Risk PIDs, BowTies, and Timelines to ensure a more effective, dynamic approach to risk management.
Innovation Management
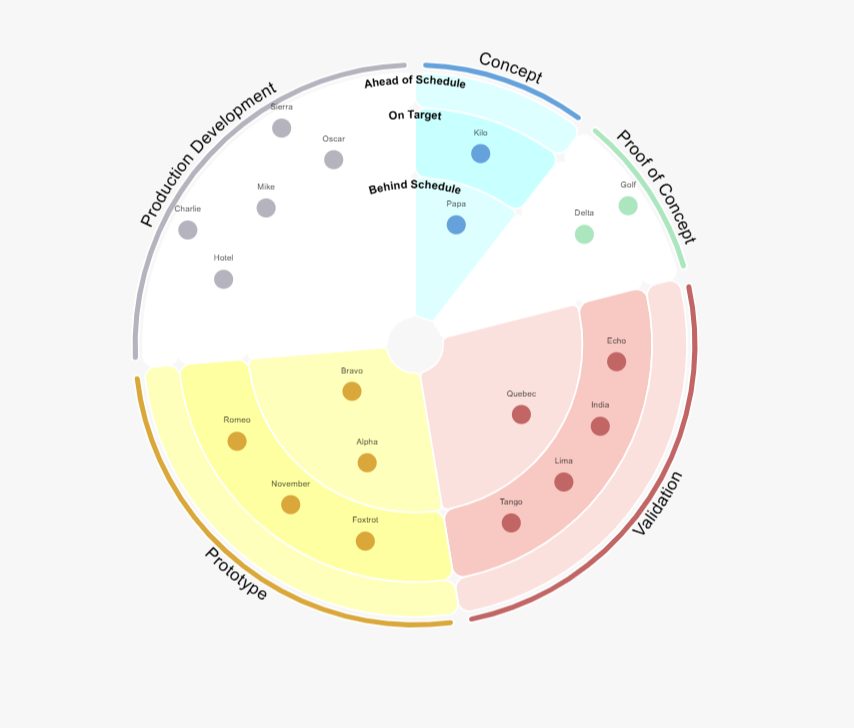
Timing is everything in innovation! Manage, track, and communicate research projects in one place. Explore from multiple angles, uncover connections, and keep teams aligned to drive the right ideas forward at the right time.


What our customers say
cutting-edge use of roadmapping and visualization technology.”
.png)
.png)
around. SharpCloud give us better visibility of our data. It allows us to bring in
data from different parts of the business, meaning the customer can see it more easily.”
.png)
visibility across the complete portfolio. SharpCloud allows us to examine the
relationships between different items in our technology roadmap, then dive
deeper into the data for a greater level of detail.”
.png)
on action tracking, progress updates, and closures. It has been transformational
in showing information in this way to multiple risk control and action owners."
.png)
Why our customers choose us
Relationship clarity
Say goodbye to fragile spreadsheets full of complex dependencies that are hard to maintain and even harder to understand. Step into a world where you can easily connect and relate your data.
Before making any decision, it’s crucial to see the full picture. We help you to do just that with clear, interactive visuals that show how your landscape is connected. Explore related data from different angles, to ensure you have the best chance of seeing the potential impacts of a decision.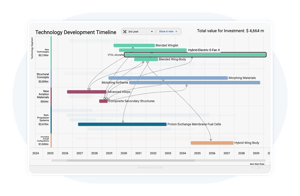
Seamless integrations
Struggling to get a clear picture from all your different tools? We make it easy to connect with platforms like PowerBI, Azure DevOps, Jira, Snowflake, and many more.
No need to move your data - keep it right where it is, and we’ll handle the heavy lifting to bring everything together seamlessly.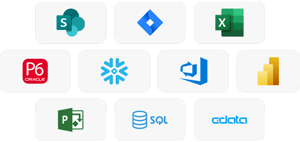
Dynamic visualization
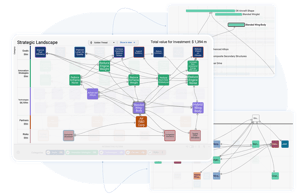
Preparing the same charts and tables for the monthly and quarterly meetings? With our wide range of interactive views - from Timelines to Radars - you can easily showcase your data in different ways.
Simply select the view type you want to display and then select which data is important to tell your story effectively, without the repetitive work.
Collaborative support
Your success is what we're here for! Our team can help you get the most out of SharpCloud by working on custom projects tailored specifically to your requirements.
We've supported companies in creating bespoke views, outputs, and connectors to custom built tools, ensuring their stories are told effectively.